Interesting in development
graphview_plus: an interactive graph for Flutter
A Flutter widget that lays out graph nodes with d3-style physics and lets users pan, zoom and drag them.
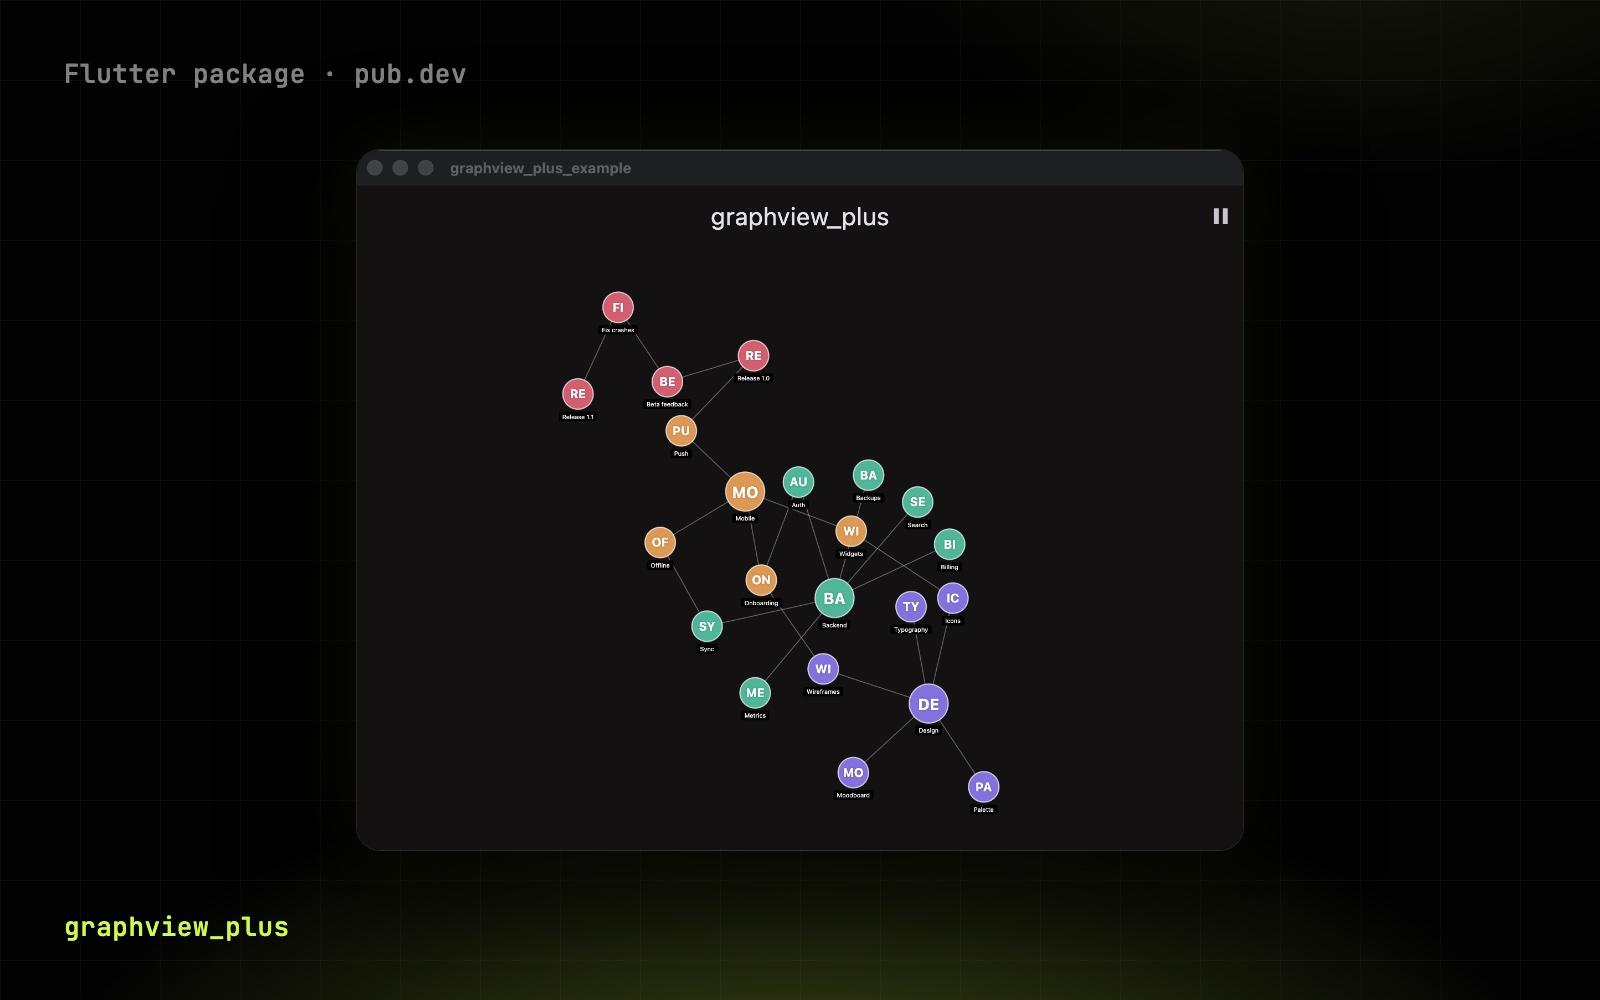
Relationships between tasks, people or entities are easier to grasp when you can see them on a diagram. But a physics-based graph often jitters endlessly, nodes overlap, and the CPU keeps working even when nothing on screen changes.
graphview_plus lays out nodes with a d3-force style model: forces cool down gradually, and within a few seconds the graph comes to rest and stops repainting. Nodes never overlap, the graph can be panned and zoomed, nodes can be dragged and tapped, and the controller adds nodes and links on the fly without moving the ones already placed. The package depends on nothing but Flutter, and the GraphSimulation core is pure Dart, so it works in unit tests.
The package is useful for teams that need to show relationships between data in an app, such as tasks and their subtasks. Repulsion, link distance and link stiffness are plain properties, so the graph is easy to tune to the data of a particular project.
Open on pub.dev